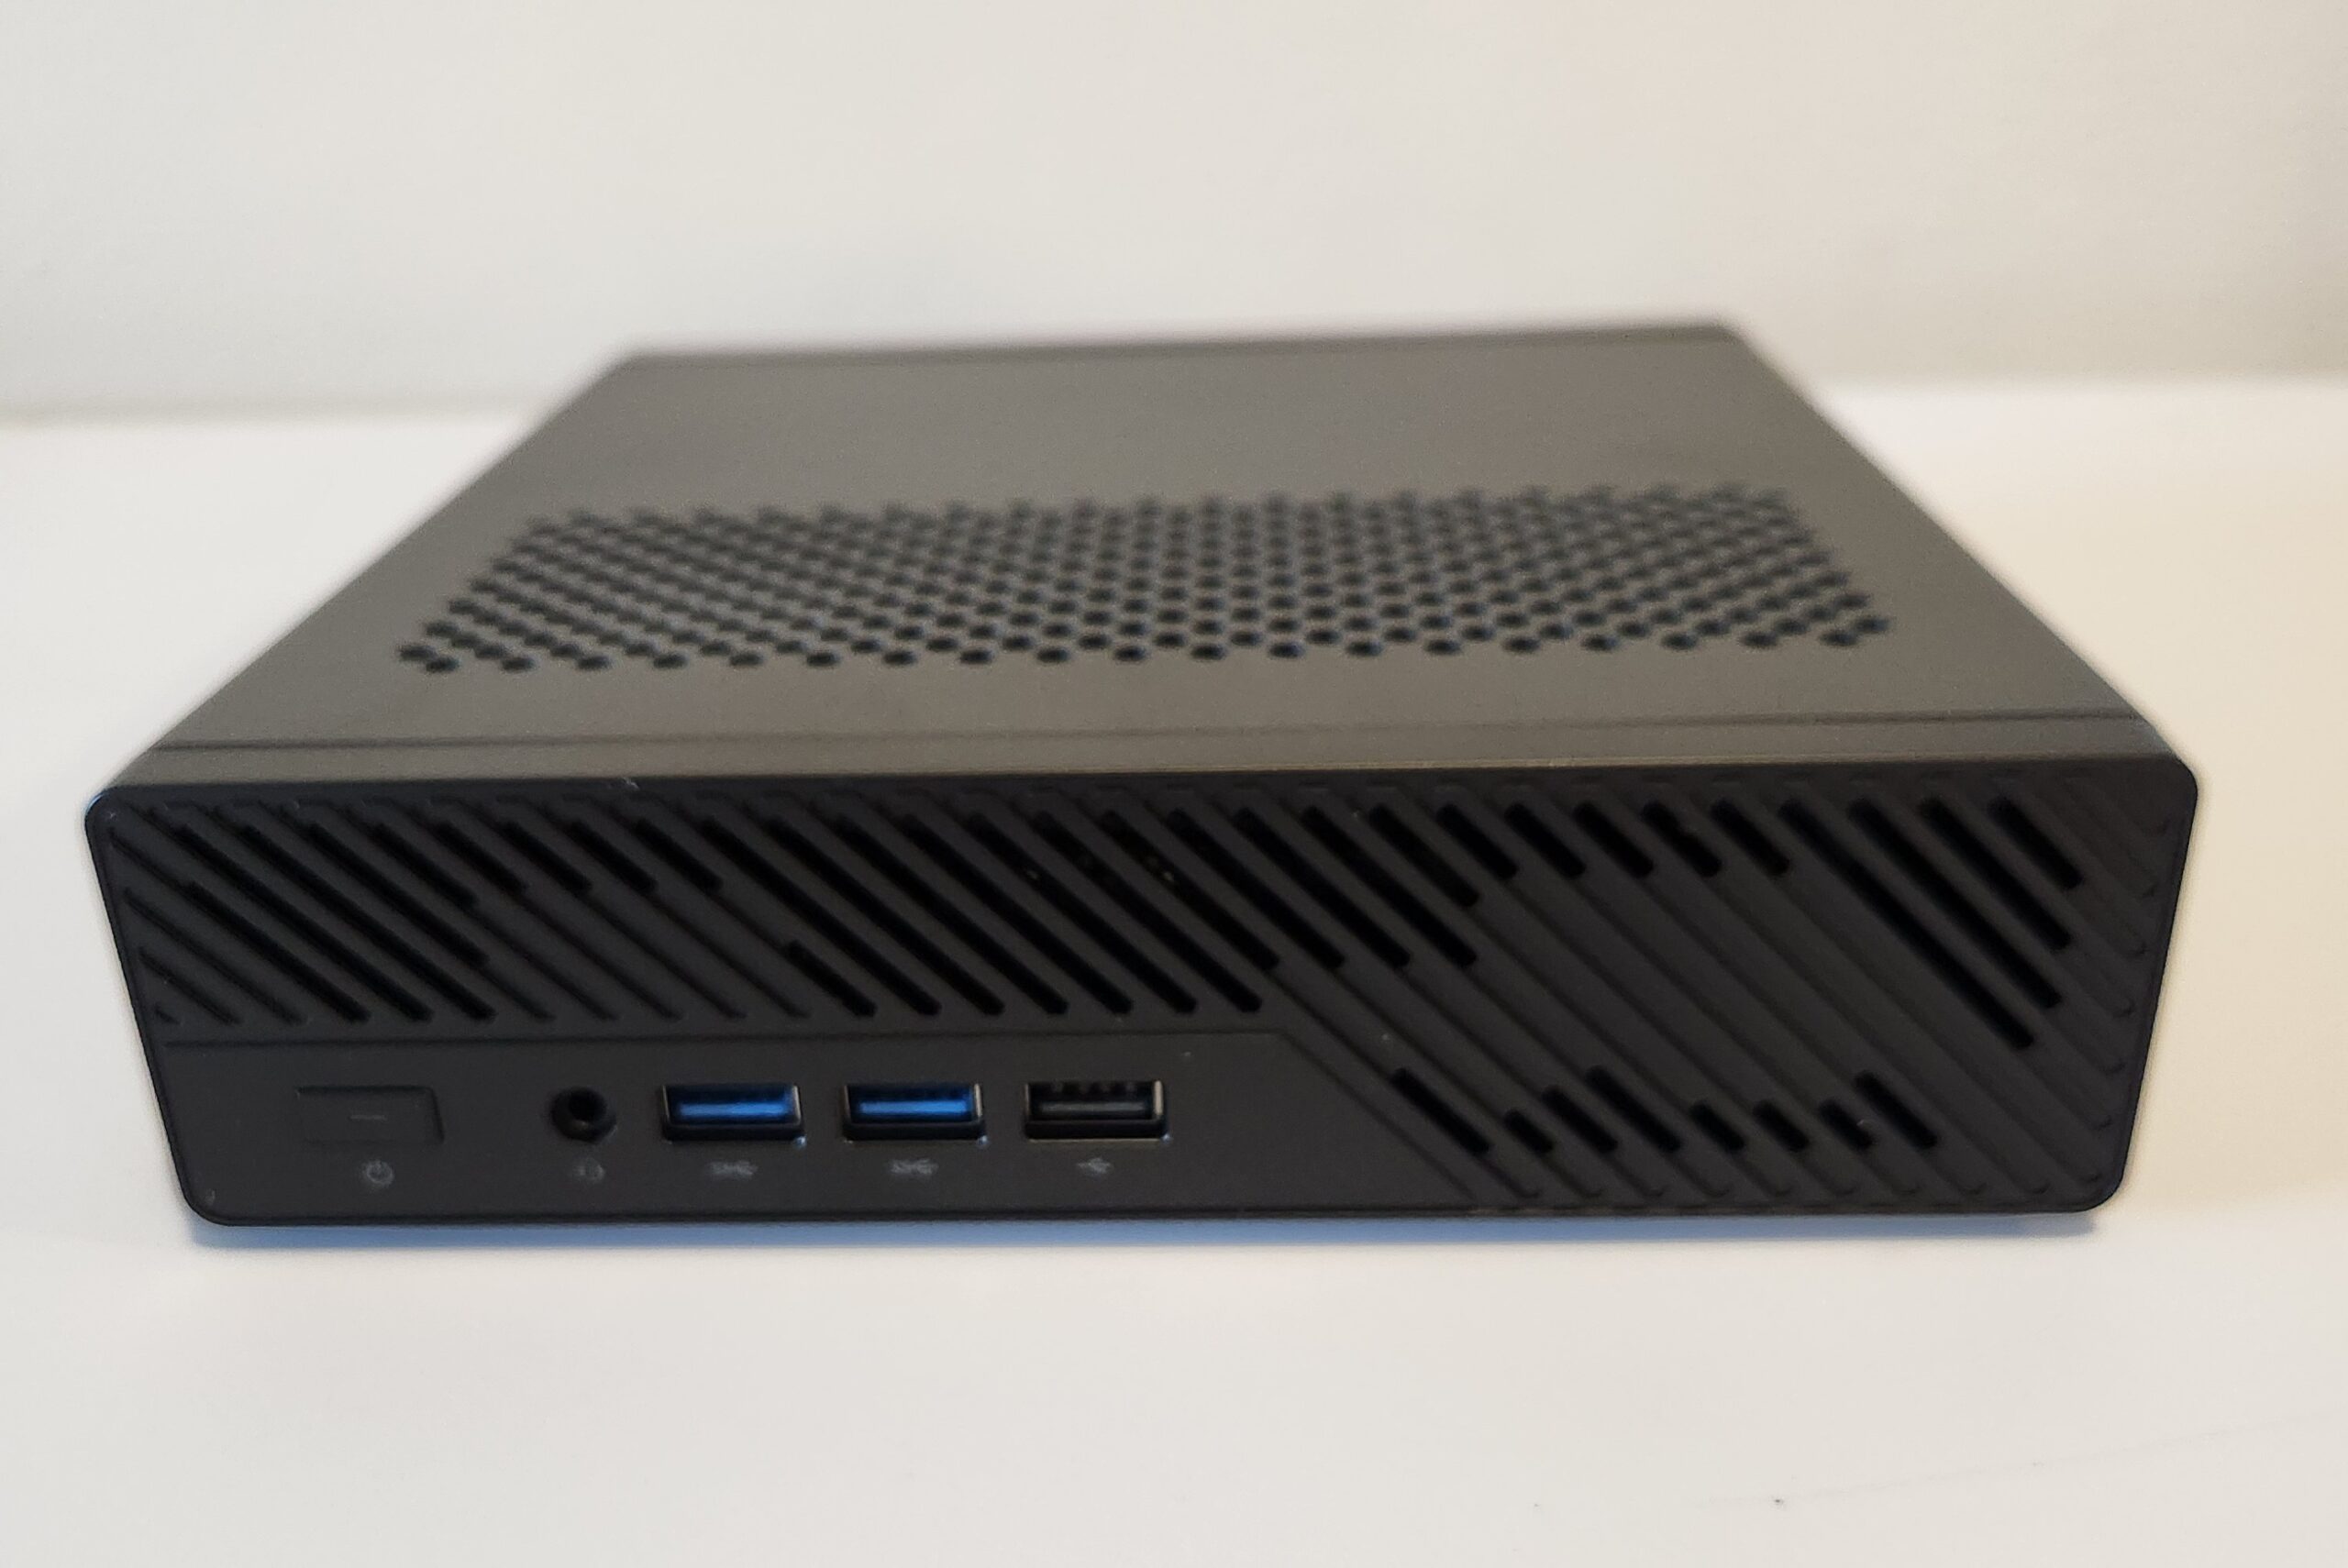
Minisforum MS-A2 Unboxing and Hardware Review
Hands-on review of the Minisforum MS-A2 mini PC with dual 10GB SFP+ ports, AMD Ryzen 9000 series, and toolless design - perfect for home labs.
Read more →Home Lab Builds, Reviews, and How-Tos
Hands-on review of the Minisforum MS-A2 mini PC with dual 10GB SFP+ ports, AMD Ryzen 9000 series, and toolless design - perfect for home labs.
Read more →
I apply the zero trust firewall model to my email management. All incoming emails route to an Unsorted folder via a catch-all rule, and only emails matching specific sender and subject rules make it to my Inbox. I cover folder structure, routing rules, Outlook’s Sweep feature, and my annual archiving process.
Read more →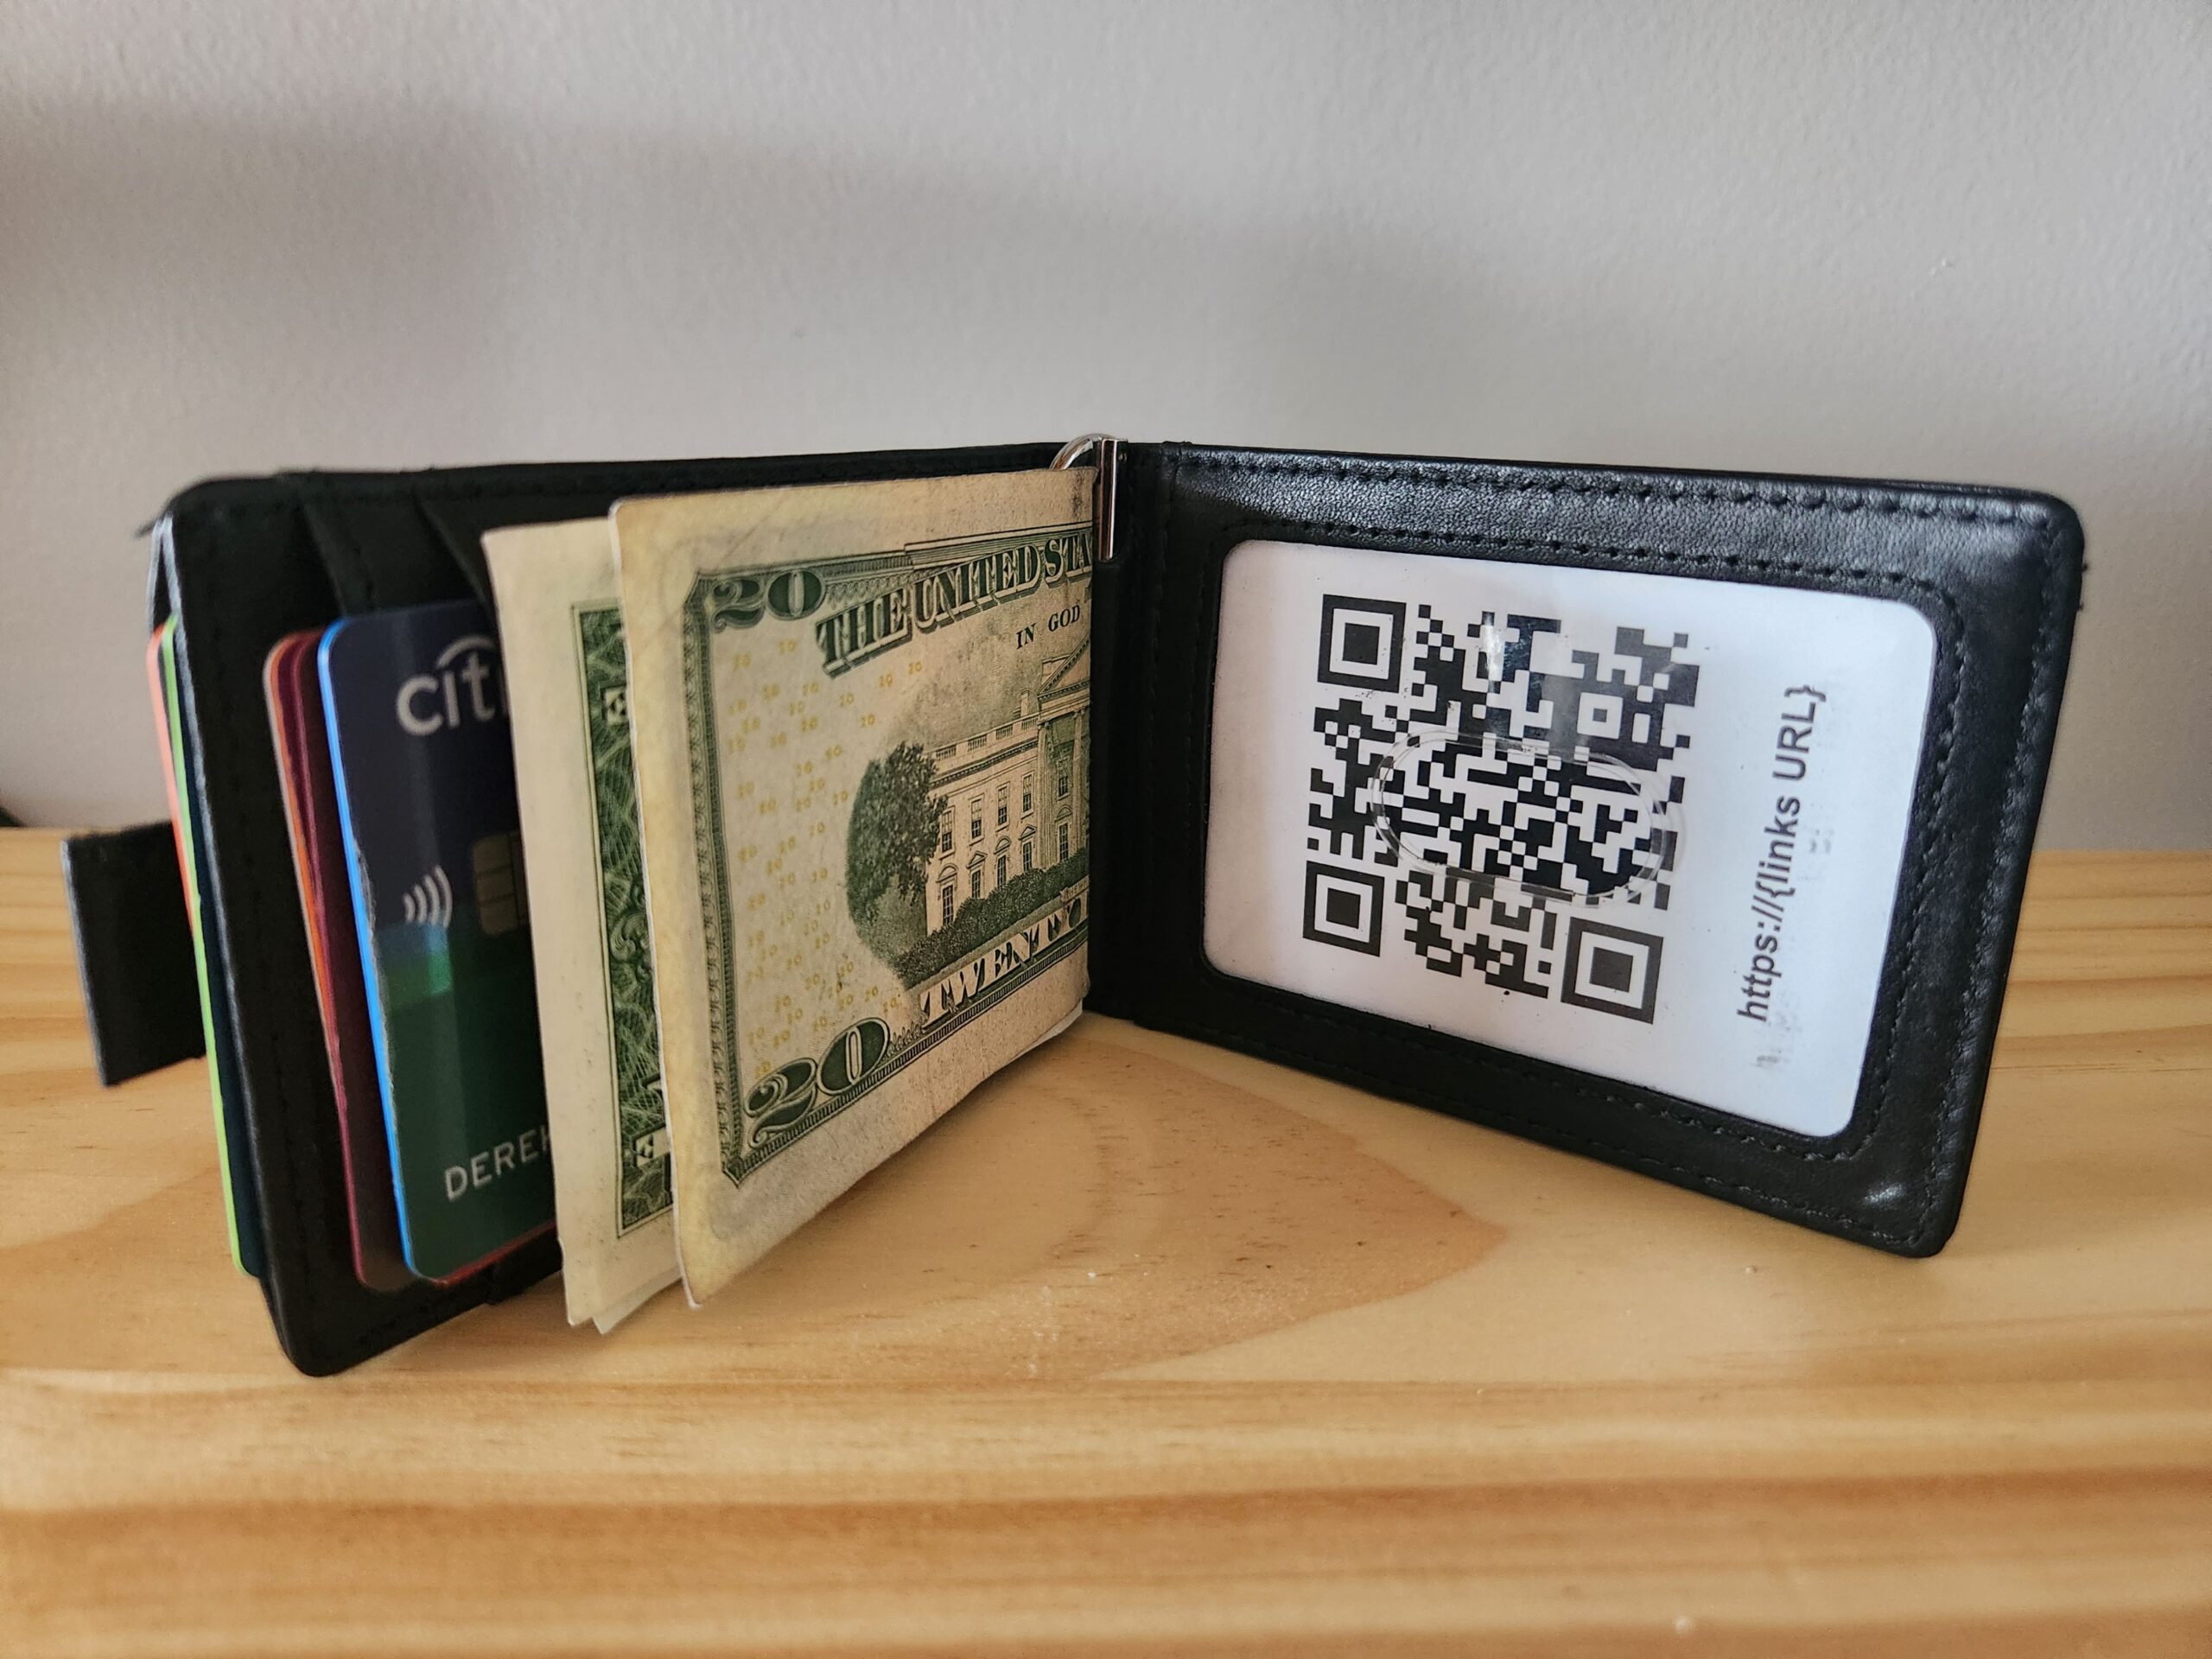
A creative way to repurpose the ID card window in your wallet with a custom card featuring a QR code linking to your social media and contact info, an emergency contact list, and a hidden cash stash. Includes a printable template and step-by-step instructions.
Read more →Seerr is a community-maintained fork of Overseerr that picks up where the original left off. This post walks through migrating your existing Overseerr Docker container to Seerr on Linux, including backing up your data, fixing permissions, and updating your Compose file.
Read more →A walkthrough for resetting a Cisco edge switch to factory defaults using the CLI. Covers what you need to get connected, how to boot into recovery mode, which files to delete and why, and what to expect when the switch comes back up clean.
Read more →
How a month of heavy AI use changed my approach to problem-solving — and how I built a fully functional Inlander Restaurant Week app in under 20 minutes before dinner was even over.
Read more →A walkthrough of building and deploying a static website using Hugo. Covers installing Hugo, creating a new site, adding a theme, writing content, building the site, and serving it with Nginx on Ubuntu Server.
Read more →
Learn to identify common scams like AI deepfakes, SMS spoofing, and fake IT support. Practical tips to protect yourself and your family from bad actors.
Read more →Step-by-step commands to completely uninstall Ceph and reset its configuration on your Proxmox cluster for a fresh start.
Read more →
I took some time off after my 2024 challenge to post new content every weekend. It ended up getting the better of me and my time. I also had a few really big life events at the end of 2024 and through 2025 which took up all the free time I had. Well…I’m back and with a whole new look!
Read more →
After years on a dated WordPress setup, a brand new website is in the works—faster, cleaner, and built from the ground up with a modern design.
Read more →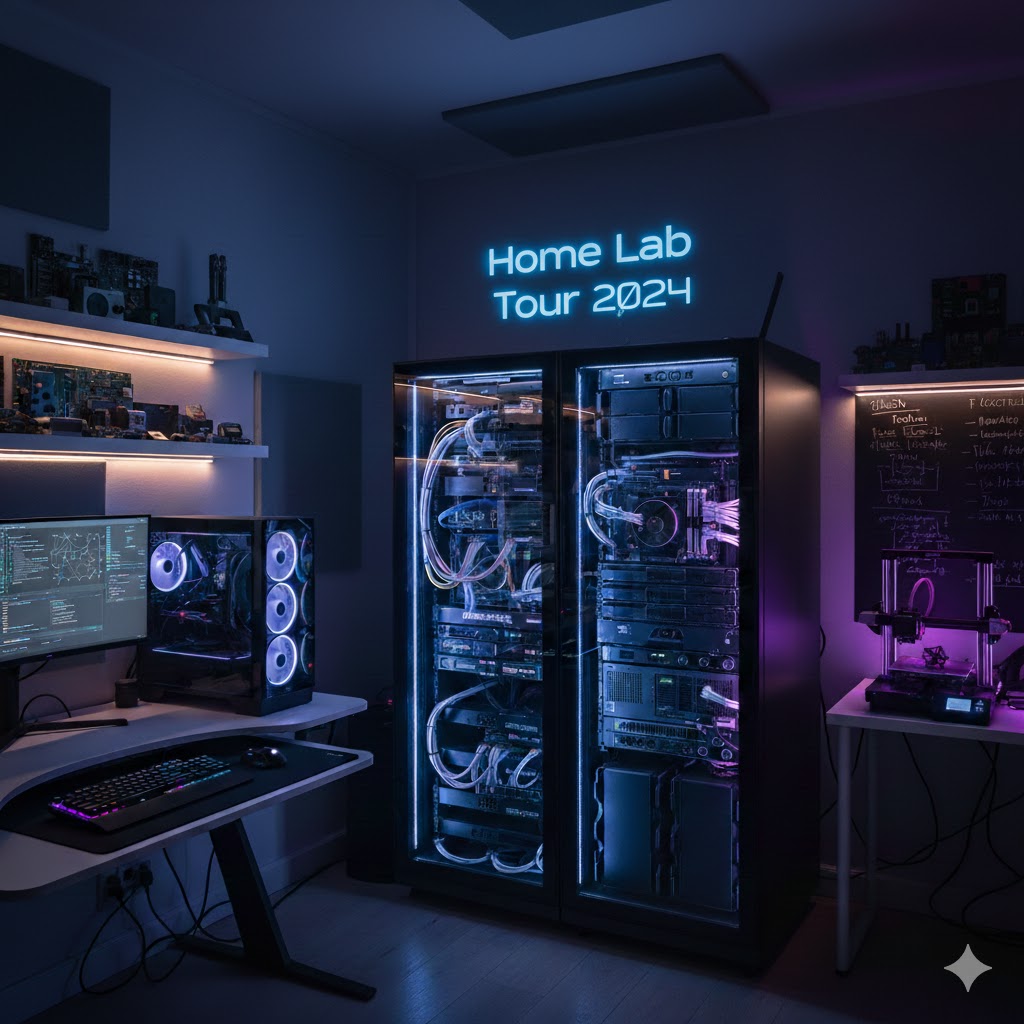
A full tour of my home lab setup for 2024 covering servers, storage, networking, security cameras, and Docker containers. Documenting where everything stands at the start of the year.
Read more →