My recent move to NFS shared Docker volumes, which lead to life cycling some older systems, which lead to going back and updating a lot of side systems that I haven’t had time to update in a while. One of these systems was my Uptime-Kuma container. Those of you not currently running Uptime-Kuma in your home lab, definitely check it out (HERE is a link to my walk through on setting it up).
One really nice feature they added to this monitoring system is the ability to monitor Docker containers. This adds some advantages over just monitoring if the website or port is available. You can see if the application is actually having issues or if it’s a firewall issue. Also, for deployments with a database that don’t have an actually external service for you to monitor, this can track and alert if those containers have issues. I feel like this setup is a must for anyone with a complex Docker deployment.
In this walk through, I’m going to cover all the configuration of the services on your Docker host to allow Uptime-Kuma to connect externally to the system and then walk you through configuring a monitor of a container for both local or remote.
Prerequisites
You will need a Docker host setup and running. This can either be the same host that you are running Uptime-Kuma on or a totally different server. I’ll show you how to connect directly to the local Daemon or over the network. Here are the walk throughs you can use to setup your Docker host.
- Install Ubuntu Server 24.04 LTS
- Things I do after installing Ubuntu Server
- Install and Configure Docker, Docker Compose, and Portainer on Ubuntu Server
I’m also going to assume you have an Uptime-Kuma instance built out and already monitoring some of your services. Below is a walk through that will help you get this going, it’s a little out of date (may need to update the config soon) but it will still get you up and running.
Make sure if you have Uptime-Kuma on a different network with a Firewall in between, you update the configuration so the monitor is able to get to that host.
Update Stack so Uptime-Kuma has Access to Local Daemon
First thing I want to cover is connecting Uptime-Kuma to the Local Daemon if you are running containers on the same Docker host. This is recommended so you can get best performance and you don’t have to go out on the network to access and monitor.
Within your Uptime-Kuma Stack/Docker Compose file, you just need to add this line under “volumes:”:
- /var/run/docker.sock:/var/run/docker.sock

This will map the .sock that is on the host system to the .sock inside the container.
Update and re-deploy Uptime-Kuma and you are all set. I will cover configuration of this later in the article.
Configure Docker Daemon for Remote Connection
If you are trying to monitor containers that are running on a different host then where your Uptime-Kuma container is running, we will need to expose the Daemon to the network and allow connection.
SSH or Console into the system that you want to monitor.
Once in, we need to make a directory to store a configuration file. Enter this command to create it:
sudo mkdir -p /etc/systemd/system/docker.service.d
Now we need to create the configuration file in that folder and enter nano so we can configure our options:
sudo nano /etc/systemd/system/docker.service.d/options.conf
Copy this information and paste it into the conf file:
[Service]
ExecStart=
ExecStart=/usr/bin/dockerd -H unix:// -H tcp://0.0.0.0:2375
Once you have entered the information, press “Ctrl + X” to exit and then press “Enter” to save the file.
Now we just need to reload the daemon and restart the Docker service. Be careful doing this on a system that is already running containers, it will restart the containers as though it is a full system reboot.
sudo systemctl daemon-reload
sudo systemctl restart docker
Do this on all your Docker hosts that you want to setup monitors on.
You are now all configured for external connection.
Setup Docker Hosts in Uptime-Kuma
Now we need to add the connection in the Uptime-Kuma interface so you can use that Docker host as a monitoring point.
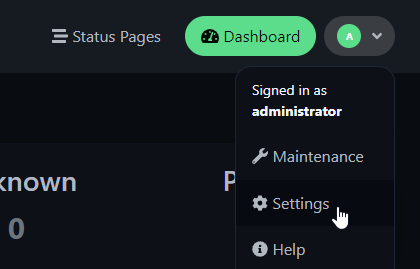
Login to your Uptime-Kuma interface. Navigate to “Settings” in the upper right corner.
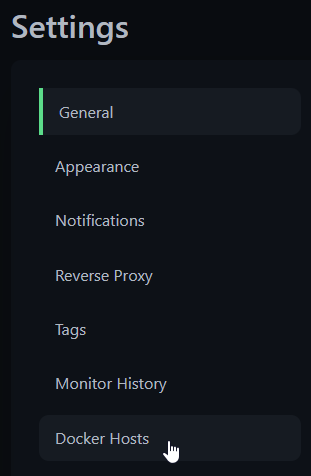
Under Settings, navigate to the “Docker Hosts” page.
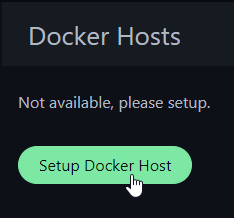
Click on “Setup Docker Host”.
First host I will configure is the Local host, the same system my Uptime-Kuma container is running on. It already comes pre-configured with the Connection Type of Socket and the Daemon path, which we setup earlier in this walk through. Simply enter a Name for the host and then click “Test”.
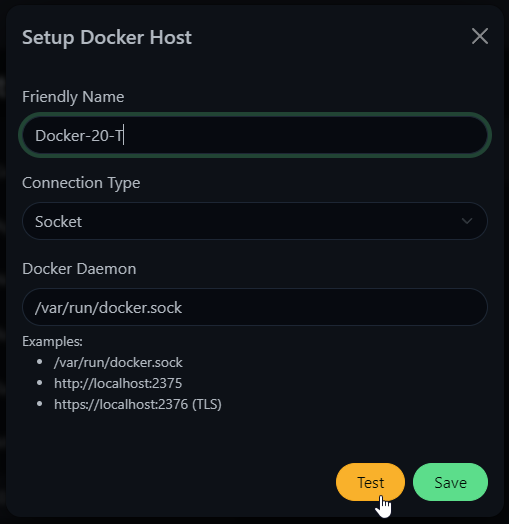
Assuming your container is configured correctly with the volume for the .sock file, you should get a green popup that looks like this, showing the number of containers you have running on that system. If you get a red error popup, go back and check your .sock mapping or try setting up the external access and configure it to connect over the network.

Back on the “Setup Docker Host” window, simply click “Save” to finish the setup.

I’m going to now configure the connection to a second separate Docker host over the network.
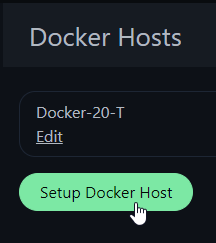
Click the same “Setup Docker Host” button.
Enter a Friendly Name for this host. Then change the Connection Type to “TCP / HTTP”. Under the Docker Daemon configuration, we want to delete the predefined .sock entry and enter the following with your Docker host’s externally accessible IP address:
http://{host address}:2375
Once you have all that information entered, click the “Test” button.
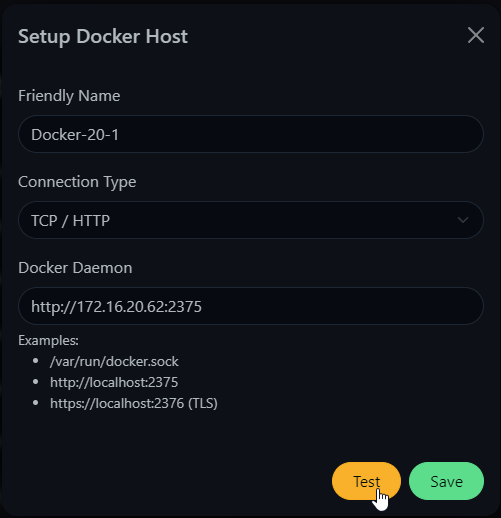
Just like when connecting to the local Daemon, you should get a green popup that looks like this with the current number of containers running. If you get a red error popup, make sure your Uptime-Kuma container can actually access the other host by creating a ping monitor. You could have a firewall enabled somewhere blocking the traffic.

Back on the “Setup Docker Host” window, simply click “Save” to finish the setup.

Now that we have our two Docker hosts setup, lets setup a monitor for a container.
Setup a Monitor for a Container
First monitor I’ll configure is for the Portainer container that is running to manage the containers on this same Docker host that Uptime-Kuma is running on.
In the top left corner of the Uptime-Kuma interface, click the “Add New Monitor” button.
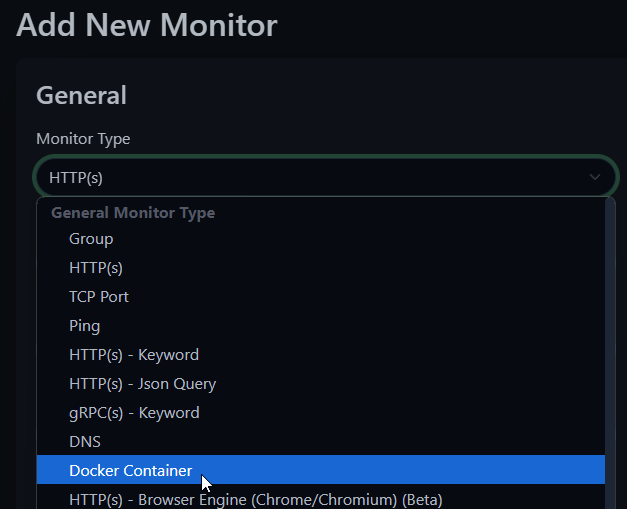
Under the Monitor Type, click the dropdown and select “Docker Container”.

Enter a “Friendly Name” for the monitor. This while be how you see it inside Uptime-Kuma. Then enter the “Container Name / ID”, this is the exact name of the container that you want to monitor as it shows to the Docker host. You can find this in Portainer under the “Container” page or by running the “docker stats” command on the host. Last required configuration is to click the dropdown under “Docker Host” and select the correct Docker host that we configured previously.
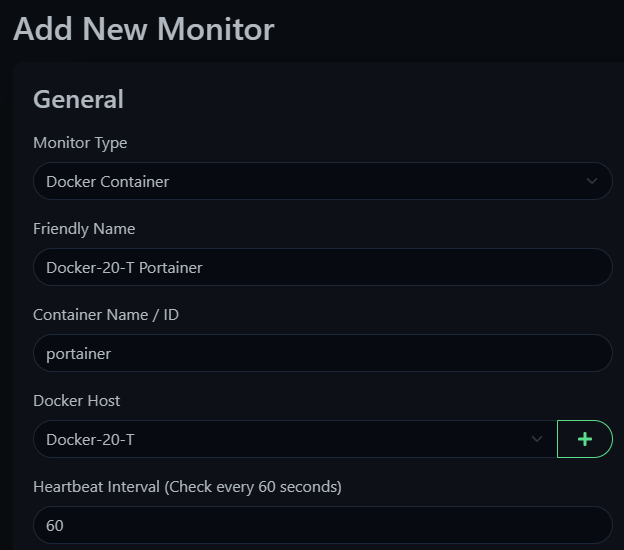
For most containers, I usually leave the rest of the settings as default and apply the “Tags” I have on my system that pertain to this system. When you are done, click the “Save” button at the bottom of the page.

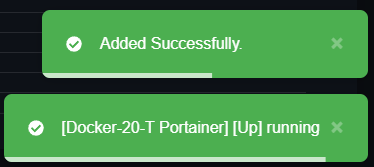
Once it is added, you should see two green popups letting you know that it was “Added Successfully” and that your “Portainer is running”.
The next monitor I want to setup is for the database for CHNS.tech’s WordPress instance that is running on a different Docker host to show how easy and powerful this setup is. This container doesn’t have an externally accessible interface or anything outside the host to monitor the status of it.
In the top left corner of the Uptime-Kuma interface, click the “Add New Monitor” button.

Under the Monitor Type, click the dropdown and select “Docker Container”.
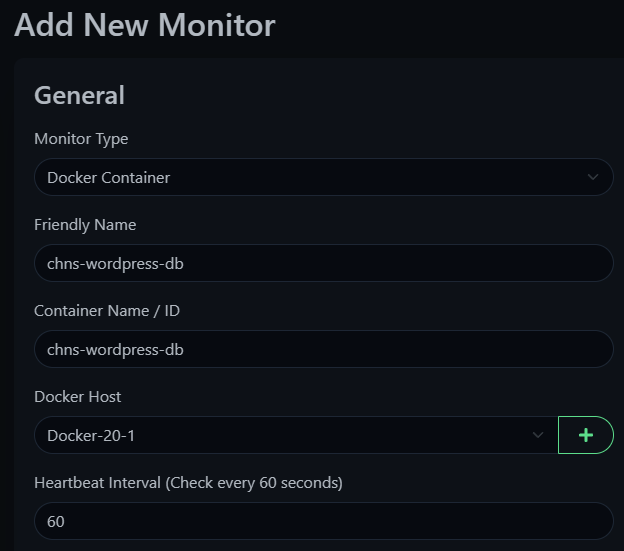
Now enter all the same information but specific to this container, like “Container Name / ID”. Under “Docker Host”, we now want to click the drop down and select the other host we configured. I’m going to leave the rest of the settings as default and click “Save”.
Assuming all the connections and configurations are setup correctly, you should see the same two green popups letting you know it was “Added Successfully” and that it is running.
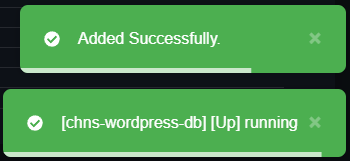
This is huge for monitoring the status of more complex Stack/Compose deployments that might have multiple containers built into the same config but only a single external port or interface for monitoring. You simple call out each individual container in it’s own monitor.
Another thing that I like about monitoring the individual containers is if you have Watchtower deployed on your systems to automatically update your container images, this can help you monitor when it updates the container since it causes downtime. You do have to shorten the Heartbeat Interval for those containers you care about as low as you can (20 seconds) to get more accurate numbers but it does help.
If you implemented this in your system and this article helped you get it setup, drop a comment below and let me know how it went. If you have anything you would change or add, also drop a comment and I’ll check it out.
