Doku is a simple, lightweight web-based application that allows you to monitor Docker disk usage in a user-friendly manner. I am currently in the middle of re-organizing and optimizing some of the load on my Docker host servers. This container came in super useful to figure out hard disk sizing for the servers and understanding just how much space each container uses.
Prerequisites
I will be setting this up on Portainer utilizing Docker containers running on Ubuntu 22.04.1. Here are my setup guide for all of those pieces of software:
- Installing Ubuntu Server 22.04 LTS
- Things to do after installing Ubuntu Server
- Install and Configure Docker, Docker Compose, and Portainer on Ubuntu Server
Deployment
Copy this code to a new Stack on your Portainer. Update the information you can change for your deployment and deploy the Stack.
---
version: "3.9"
services:
  doku:
    container_name: Doku
    image: amerkurev/doku:latest
    ports:
      - {port number}:9090
    volumes:
      - /var/run/docker.sock:/var/run/docker.sock:ro
      - /:/hostroot:ro
    restart: always
Stuff to change for your deployment:
- Version – This is to be determined by the version of Docker you are running on your server. You can find this by entering the command “docker -v”. Here is a link to the Compatibility Matrix.
- Image – I recommend just doing “latest” and it will pull the current version. If you want to do a specific version, here is a link to the Doku Tag page.
- Ports – You will want to update this to a port that works well inside your environment. It will be the port that you connect to the web interface of the container. The default is port 9090 which is fine if you don’t already have something on that port.
- Restart – You will want to set this to the way you want docker to handle the restarting of the container. Here is a link to the Restart Policies to choose from. I prefer “unless-stopped” so if it crashes or the server restarts, it will automatically restart the container but if you stop the container manually, it won’t try to start it on the next server restart.
Important Note on Volumes:
Usually it doesn’t matter where you point the volumes for a container and is up to personal preference. For this container however, you will want to leave that alone so it can fully access the file system and pull in all of the information in a Read Only state.
Access Web Interface
Deploy the stack onto your Docker host and then access it by going to http://{url of your host}:{port number}. The URL will be the name of your server or the entry you have in DNS for it and the port number will be the number you entered in the configuration separated by a semicolon.
You should see a interface that looks like this:
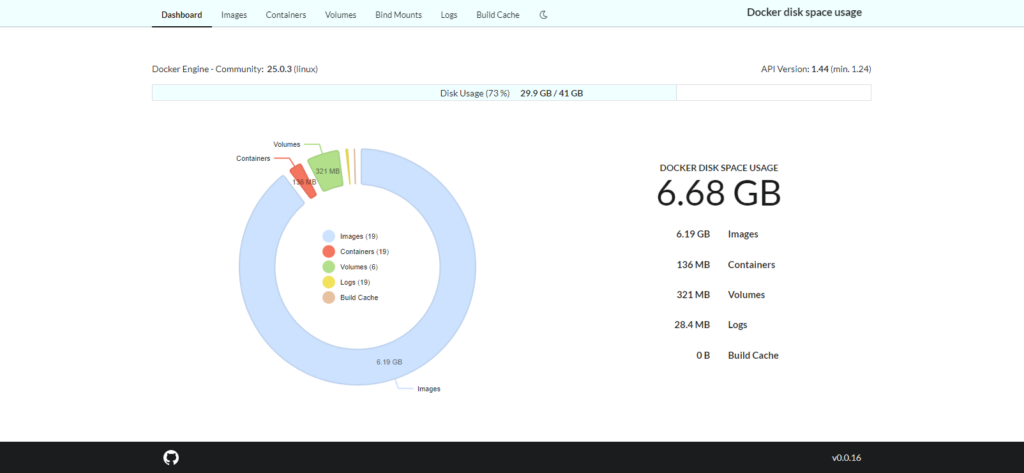
You can change it to Dark mode by clicking the moon icon at the end of the menu buttons.
Here is a synopsis of each information page:
-
Dashboard – From the dashboard, you can see what Docker Engine version you are running in the top left corner. Right under that, you will see the overall disk usage of the whole server. Under that, it gives you a pie chart overview of everything its reading related strictly to Docker. If you scroll down, you get a breakdown of each docker container and how much space its using.
-
Images – Switching tabs on the top menu to Images, this screen gives you a comprehensive breakdown of all the container images on your host. This is super nice to see just how big some of the files you are downloading when deploying a new container.
-
Containers – This page gives you a breakdown of each individual container. This is useful if you are deploying a stack with multiple containers, like an application and database, you can see if a database is growing out of control.
-
Volumes – This page shows the individual volume files on the docker host. I personally don’t use a lot of docker volumes with my setups, I usually just map directly to the file system. This does shed some light on to the black box they can be without having to dig into the file system through the CLI of the container.
-
Blind Mounts – This page I do use since I don’t often use Docker volumes. If you map your container storage directly to the file system, you can see each container mount point and how much space its using.
-
Logs – This tab shows you if any of your containers are creating large log files. This can happen if the container is high use and the logs for the interactions with the container a verbose. Like an externally accessible webserver or a monitoring container.
-
Build Cache – From reading documentation, I believe this has something to do with the container building process. I don’t build my own containers currently so I don’t have any entry in this tab.
That’s it for this container. A very simple yet powerful tool for server management. Hope this helps you on your home lab journey.
Special thanks to MariusHosting for doing a guide on this container so I could find it. Check out his article below on deploying it on a Synology NAS.