Uptime-Kuma is a self-hosted monitoring tool, like Uptime Robot. You can use it to monitor HTTP, HTTPS, TCP Ports, HTTPS Keywords, PING, DNS Records, Push, and Steam Game Servers. It has almost 100 way to notify you of your system status, including Email (SMTP), Telegram, Discord, Slack. It even has Status pages which you can make public and map to specific Domains.
This walk through will consist of the stack deployment and some basic configuration for the interface.
Deployment
Copy this code to a new Stack on your Portainer. Update the information you can change for your deployment and deploy the Stack.
---
version: '3.8'
services:
  uptime-kuma:
    image: louislam/uptime-kuma:latest
    container_name: uptime-kuma
    volumes:
      - /home/{username}/config/uptime-kuma:/app/data
    ports:
      - {port number}:3001
    restart: unless-stopped
Stuff to change for your deployment:
- Version – This is be determined by the version of Docker you are running on your server. You can find this by entering the command “docker -v”. Here is a link to the Compatibility Matrix.
- Image – You can do “latest” and it will pull the current version. I prefer to look up the actual tag for the current version. This adds a little more management to updating however pinning it to a specific version adds reliability. Here is a link to the Uptime-Kuma Tag page.
- Volumes – This specifies where all the persistant configuration files for the Uptime-Kuma container will be stored. Update the information with your username or change the location before the “:” to a location of your choosing.
- Ports – You will want to update this to a port that works well inside your environment. It will be the port that you connect to the web interface of the container.
- Restart – You will want to set this to the way you want docker to handle the restarting of the container. Here is a link to the Restart Policies to choose from. I prefer “unless-stopped” so if it crashes or the server restarts, it will automatically restart the container but if you stop the container manually, it won’t try to start it on the next server restart.
Configure Uptime-Kuma
Now that your Uptime-Kuma container has been deployed, lets connect to it and start setting it up.
Open your web browser and navigate to “http://{server name or IP}:{port you configured in the stack}”.
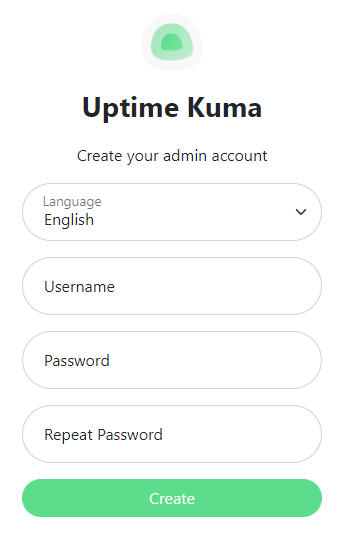
You will be prompted with a setup screen for the Admin account you want to use. Enter in the information you want and click “Create”.
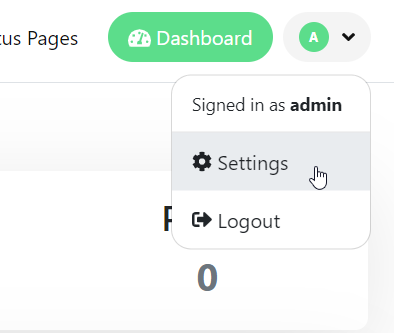
It will then take you to the Main Dashboard of the application. Lets go into the settings and customize our setup. Click on the User icon in the top right corner and click “Settings”.
On the General tab, set your Timezone and your “Search Engine Visibility” settings (for if you want search providers to be able to present people with your site).
On the Appearance tab, you can change your Language and Theme settings.
On the Notifications tab, you can setup your Notification providers. Each one has its own settings to configure to work. You will have to search online to get the proper setting for your provider.
On the Reverse Proxy tab, you will be able to configure a Cloudflare Tunnel or instructions on how to use another Reverse Proxy Service for access outside your network.
On the Monitor History tab, you can mange the settings for how long data is saved in and manage the database itself.
On the Security tab, you can change the password for the account you are currenlty logged into and enable Two Factor Authentication.
On the About tab, make sure “Show update if available” is checked. This will put a notification button in the top right corner when an updated version is available. Clicking on the button will take you to the release notes page with the updated versions information.
Setting up a Monitor
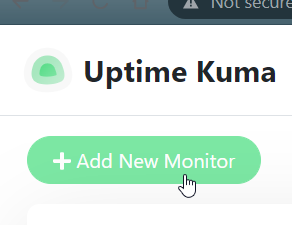
To add a new monitor, click the “Add New Monitor” button in the top left corner.
This will open a full page on the right side for customizing the settings of your monitor. Here are a few of the settings to pay attention to:
- Monitor Type – This is where you can select what type of protical you want to use to monitor a device (ex. HTTP(s), TCP Port, Ping, DNS). Each one has different settings to use so search if you don’t know what something is.
- Friendly Name – This is the name you will see for the monitor. It can be whatever you want, it doesn’t have to be anything close to the name of the device.
- Hostname/URL – This is the actual name or address of the device you want to monitor. This container will need to have the ability to reach the device through any firewalls on your network.
- Heartbeat Interval – This is the time between each time it checks the device in seconds. Keep in mind, the smaller the interval, the more load you put on the container, network and monitored device.
- Upside Down Mode – This will continue to monitor the device, however it flips the idea of it being online (Up is down). This is good for a device that you usually want turned off and want to be notified if it comes online.
- Tags – Here you can set custom tags for sorting and organizing your monitors. These will show up on the Dashboard and you can search for them to narrow what monitors are shown on the Dashboard.
Click “Save” on the bottom of the page to add the monitor and start scanning. As soon as you save it, it will show up Green in the bottom right corner or show up Red if it cant see it.
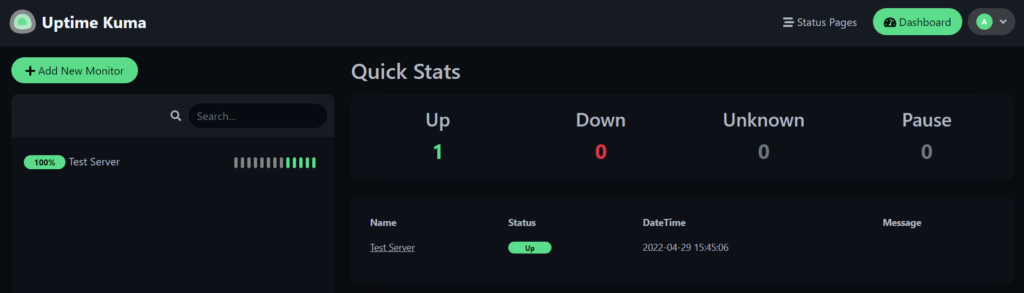
Back on the Dashboard, the left panel will show you all your monitors. The right panel will show you a sumery of your current status. If you click on the monitor, it will pull up more detailed information on the right panel.
Setup a Status Page
You can make publicly accessible pages for people that don’t have a login or if you want a quick way to see the status of some specific monitors.
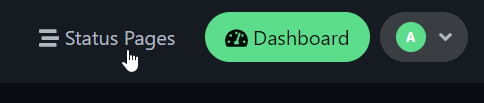
Click the “Status Pages” button in the top right corner.
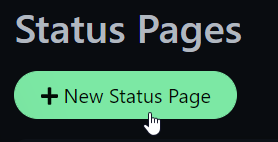
Click the “New Status Page” button above the right panel.
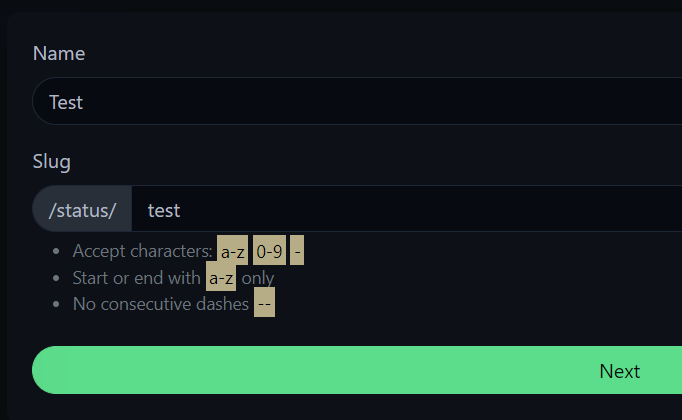
Enter a Name for the Page, the name you want in the URL that people will use to get to the page and click the “Next” button.
This will take you to the Status Page editor. On the left panel, you can change all the settings to fully customize the look of the status page.
On the right panel, going from top to bottom:
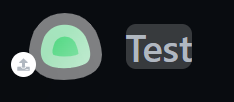
You can change the Icon you want the page to us and the Name of the page.
Clicking “Create Incident”, you can make a temporary post that will show up on the top of the status page. You can use this during an outage to explain the outage to your users or giving them information on what to do next.
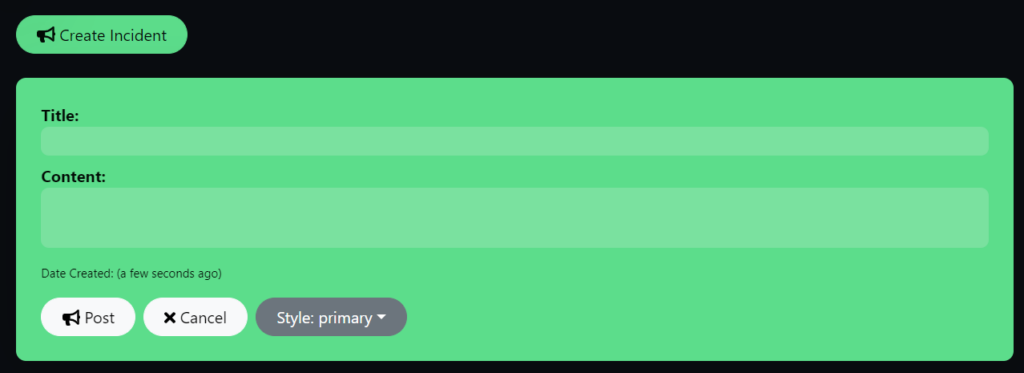
Description – pretty self explanatory but this is where you can tell your users what its used for.
Clicking “Add Group”, you can make custom groups of monitors so you can group up different items but still want them on the same page. Rename the group by changing where it says “Services” or click the Red X to remove the group.
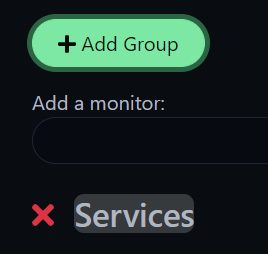
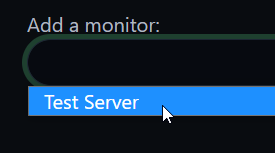
Clicking in the field under “Add a monitor:”, you can search for all your monitors to add them to this page.
Once you get all your monitors added, you can re-arange them by clicking and holding the up and down arrows or clicking the Red X to remove the monitor.
In the field under “Custom Footer”, you can enter any information you want that will show up at the bottom of the page (ex. Trademark or Site Owner).
Click the “Save” button in the bottom left corner to save the page and take you to the actual page that users will see.
You can click the “Edit Status Page” button to go back to the editor or click the “Go to Dashboard” to go back to the main Dashboard with all your monitors.
Conclusion
At this point, these are all the setting to set for this walk through however they are constantly updating this container with new settings and features so i will update it as new stuff is released.